

How to Score a 7 in IB Economics
Why the Gap Between a 5 and a 7 Is Almost Never About Content
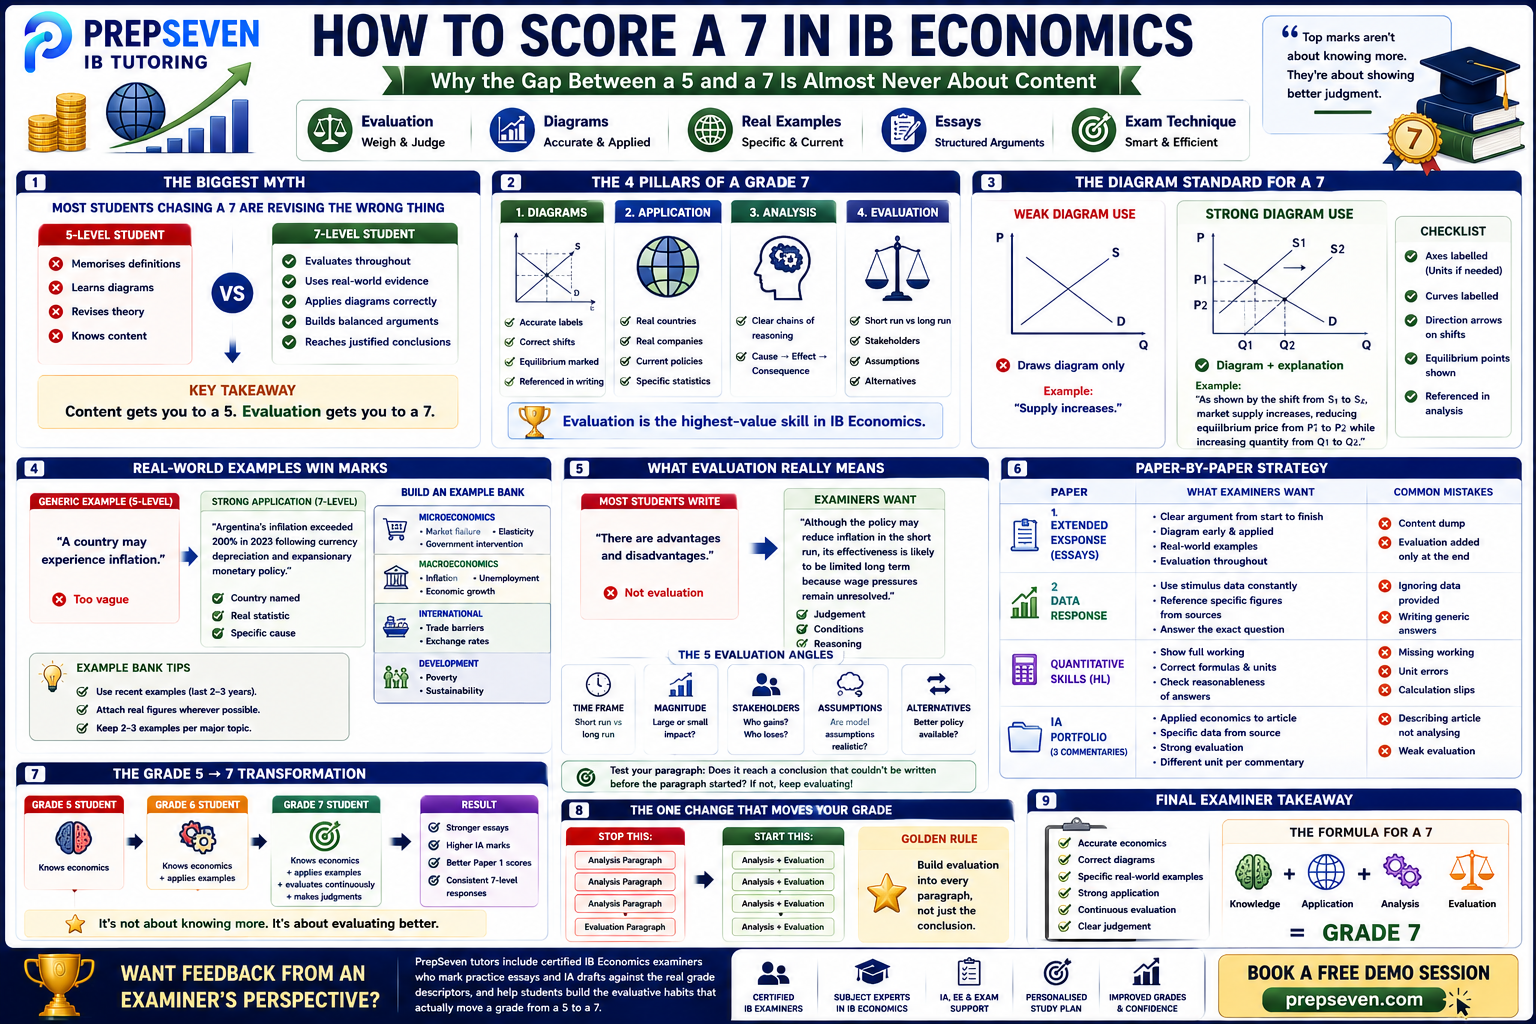
Most Students Chasing a 7 Are Revising the Wrong Thing
Talk to almost any IB Economics student aiming for the top grade and they’ll tell you they’re revising diagrams, definitions, and case studies. That’s not wrong, exactly, but it’s revealing. Content knowledge in IB Economics is necessary and almost nobody who reaches Year 2 is genuinely short of it. What separates a 5 from a 7 is something else entirely: the ability to evaluate, to weigh competing arguments with real judgment rather than just listing them, and to back every point with something specific rather than something generic.
This matters because it changes where revision time should actually go. A student who can recite the causes of inflation perfectly but writes evaluation as a single bolted-on paragraph at the end of an essay is capped well below a 7 regardless of how accurate their content is. The IB markschemes for Economics are explicit about this: analysis and application get you into the mid-range, but evaluation is what unlocks the top band, and evaluation is a skill almost nobody practises deliberately.
If you take one thing from this guide, take this: stop treating evaluation as the last paragraph you add once the real essay is finished. The strongest Economics answers build evaluative judgment into every paragraph, not as an afterthought but as the spine the whole answer is built around.
The Diagram Standard a 7 Actually Requires
Diagrams in IB Economics are not decoration. They’re assessed directly, and a vague or incorrectly labelled diagram costs marks even when the surrounding written explanation is strong. A 7-level diagram has axes labelled correctly with units where relevant, curves that are clearly drawn and properly shifted with directional arrows, equilibrium points explicitly marked, and, critically, the diagram is referenced directly in the written text rather than left to speak for itself.
The detail students most often miss isn’t the diagram itself but the sentence that connects it to the argument. Writing “as shown in Figure 1, the supply curve shifts from S1 to S2” and then explaining what that shift means for price and quantity in the specific context of the question is what separates a diagram that’s doing analytical work from one that’s just sitting on the page. Practise drawing every core diagram, supply and demand, market failure, the various elasticity diagrams, AD/AS, the Phillips curve, from memory until it’s automatic, but practise the connecting sentence just as deliberately as the drawing itself.
Real World Examples: The Detail That Separates 5s From 7s
Generic examples cost marks in a subject where application is explicitly assessed. “A country might experience inflation” earns far less credit than “Argentina’s inflation rate exceeded 200 percent in 2023, driven partly by currency devaluation and loose monetary policy.” The second version demonstrates genuine engagement with real economic events, names a specific country, gives a specific figure, and ties it to a specific cause, exactly what AO2 application is rewarding.
Building a bank of real, current examples is one of the highest-value things a student can do across the two years of the course, and it’s far more effective done gradually than crammed in the final weeks. A useful habit: keep a running list organised by unit, micro, macro, international, development, and add to it weekly with a specific country, company, or policy example along with the key figures attached to it. By the time exams arrive, a student with eighteen months of consistently logged examples has a genuinely deep bank to draw from, while a student trying to memorise fifteen examples in the final fortnight is working with something far thinner and far less specific under pressure.
- Prioritise recent examples, ideally from the last two to three years, since examiners notice when an example is current and well understood rather than recycled from a textbook.
- Attach a real figure to every example wherever possible, an inflation rate, a tariff percentage, a specific policy name, since specificity is what actually earns application marks.
- Keep two or three examples per major topic rather than one, since a question’s exact angle is unpredictable and a single example that doesn’t quite fit the question as asked is far less useful than having options.
What Evaluation Actually Means at Grade 7
Most students think they’re evaluating when they list a counterargument. Genuine 7-level evaluation goes further: it weighs the strength of competing arguments against each other and reaches a reasoned judgment, rather than simply presenting both sides and leaving the reader to decide. The IB markschemes look specifically for this kind of weighing, often signalled by language like “in the short run” versus “in the long run,” or by considering which stakeholders gain and which lose, or by questioning the assumptions underlying a model rather than accepting it at face value.
There are a small number of evaluative angles that, used well, cover the overwhelming majority of Economics questions:
- Time frame: does the policy or effect look different in the short run versus the long run? A devaluation might worsen the trade balance immediately through the J-curve effect before improving it later, and naming that distinction explicitly is genuine evaluation.
- Magnitude: how large is the effect actually likely to be in practice, not just in theoretical direction? A small tariff on a good with many substitutes will have a very different real-world impact than a large tariff on an inelastic necessity.
- Stakeholder impact: who specifically gains and who specifically loses from a policy, and does that distribution matter for whether the policy is, on balance, a good idea?
- Assumptions: what is the underlying model assuming, perfect information, rational behaviour, ceteris paribus, and how does the real-world answer change if that assumption doesn’t hold?
- Alternative policies: is there a different intervention that would achieve the same goal more effectively, and what would the trade-offs of that alternative be?
A genuinely useful test of whether a paragraph is evaluating or just listing: read it back and ask whether it reaches a conclusion that couldn’t have been written before the paragraph started. If the ending is just “however, there are also downsides,” that’s a list. If the ending is “because the effect is likely to be small relative to the policy’s administrative cost, this intervention is probably not justified in this specific context,” that’s evaluation.
Paper by Paper: Where the Marks Actually Sit
Paper 1: The Extended Response
Paper 1 rewards structured essay writing built around a clear line of argument, not a content dump. The strongest responses define key terms precisely in the introduction, use a diagram early to anchor the analysis, apply a specific real-world example rather than a hypothetical one, and build evaluation throughout rather than saving it for a final paragraph. Time management matters here too: a brilliant first half of an essay followed by a rushed, underdeveloped evaluation section caps the mark far more than students expect.
Paper 2: The Data Response
Paper 2 tests whether a student can extract and use the specific data provided in the stimulus material, not just write generally about the topic. The most common way strong students lose marks here is writing an answer that could apply to any country experiencing this issue, rather than one that explicitly references the actual figures, charts, and text given in the paper. Quote the data directly, reference specific numbers from the stimulus, and make sure every paragraph ties back to what’s actually on the page in front of you.
Paper 3: Quantitative Skills (HL Only)
Paper 3 is the most procedural of the three papers, and it rewards careful, methodical calculation work shown clearly, not just a final number. Common ways marks are lost include skipping working entirely, mislabelling units, and rushing through multi-step calculations like calculating elasticity or constructing a simple national income figure without checking the answer makes sense in context. Practising the recurring calculation types, price and income elasticity, tax incidence, exchange rate calculations, multiplier effects, until they’re automatic frees up time and attention for the written analysis sections of the same paper.
The IA: Where Strong Students Quietly Lose Marks
The Economics Internal Assessment is a portfolio of three commentaries, each based on a different published article and each covering a different unit of the syllabus, microeconomics, macroeconomics, and either international or development economics. It’s worth roughly a fifth of the final grade, and it’s graded against explicit criteria that reward many of the same things the exams do: a clear diagram applied directly to the article, real data drawn from the source, and genuine evaluation rather than description.
The mistakes that cost strong students marks here are rarely about economic understanding. They’re about discipline: choosing an article that’s too broad or too old to support focused analysis, exceeding the word limit and losing the tightness that strong commentaries need, or including a diagram that’s technically correct but not actually applied to the specific situation described in the article. A commentary that explains general economic theory alongside the article, rather than using the article to drive the analysis from the first sentence, rarely reaches the top mark band even when the underlying economics is accurate.
The Mistake Worth Fixing First
If there’s one single change that moves an Economics grade more than any other, it’s this: stop writing evaluation as a separate, final section and start building it into every paragraph as the analysis develops. This is a genuinely difficult habit to build, because it’s much easier to explain a concept cleanly first and complicate it with evaluation afterward. But examiners are reading for exactly that complication throughout, not just at the end, and an essay that evaluates as it goes consistently outperforms one that explains everything first and evaluates only in the final third.
Want feedback on your Economics essays from an examiner’s perspective?
PrepSeven tutors include certified IB Economics examiners who mark practice essays and IA drafts against the real grade descriptors, and help students build the evaluative habits that actually move a grade from a 5 to a 7.
Book a Free Demo Session at prepseven.com