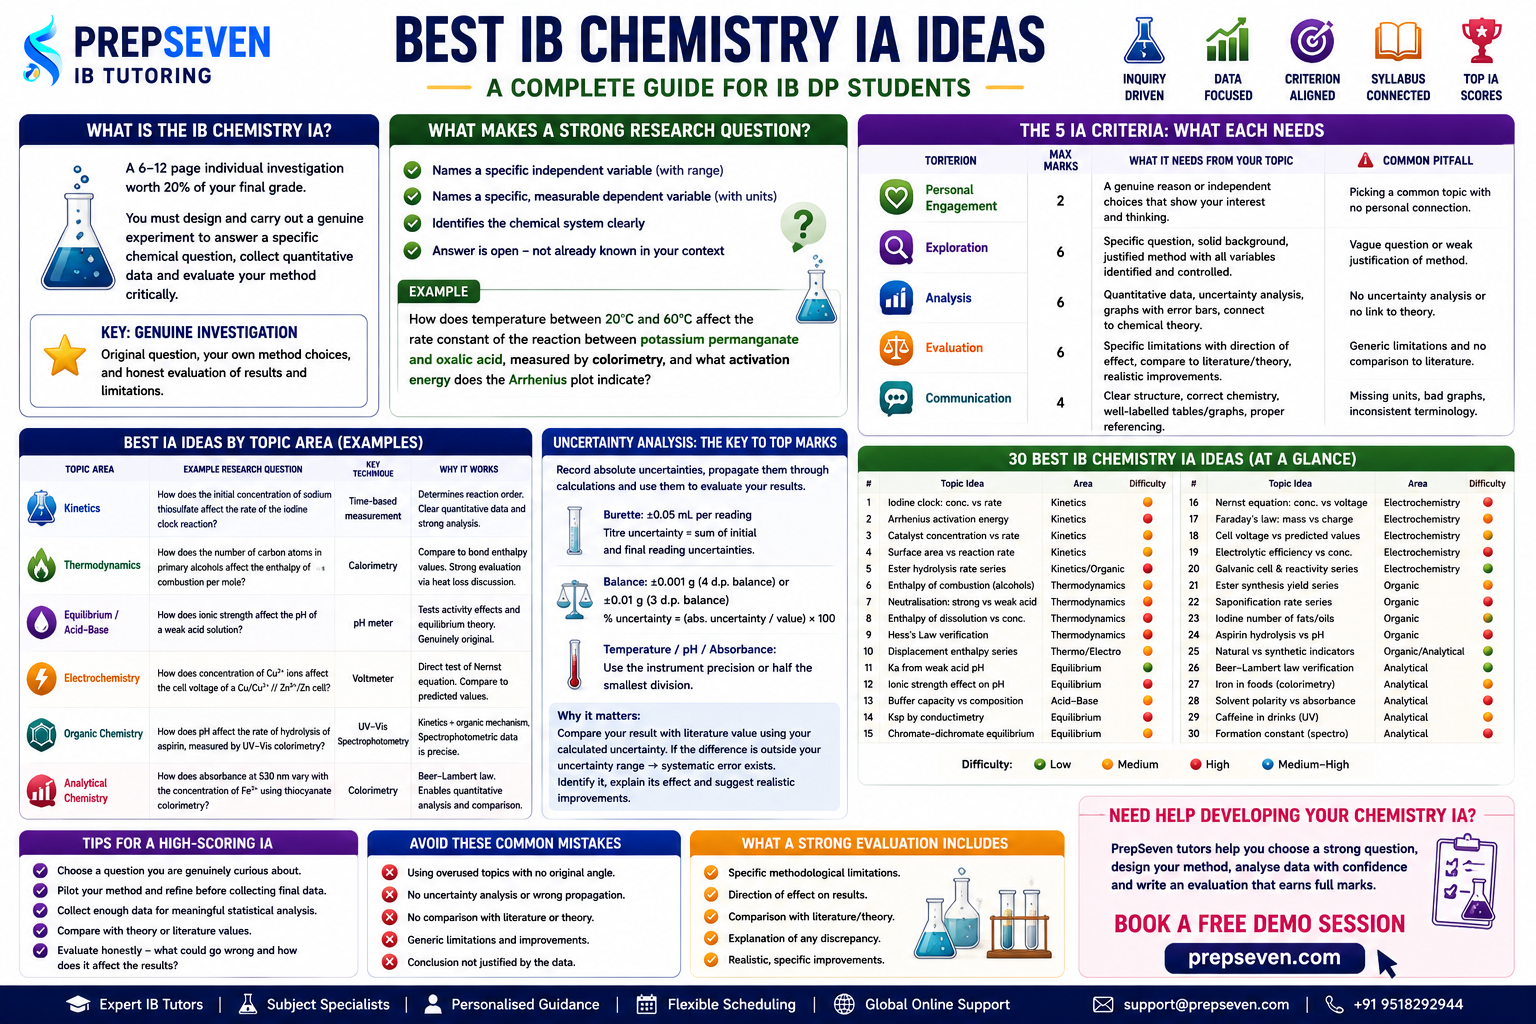
The IB Chemistry Internal Assessment is a 6 to 12 page individual investigation worth 20% of your final grade. The same five criteria apply as for all Group 4 sciences: Personal Engagement, Exploration, Analysis, Evaluation, and Communication. Chemistry IAs have one advantage over Biology and Physics investigations in terms of scoring: chemistry generates inherently quantitative, reproducible data through titrations, colorimetry, rate measurements, and electrochemical experiments, which means the Analysis criterion has natural material to work with if the research question is set up correctly.
The disadvantage is that chemistry also has the most overused IA topics of any Group 4 science. Titrations, vitamin C content, aspirin synthesis, and clock reactions have been submitted so many times that examiners immediately recognise them, and a student who follows the standard protocol for any of these without finding a specific and original angle will produce an investigation that is technically competent but earns weak marks on Personal Engagement and, often, Evaluation because the limitations are generic to the protocol rather than specific to the investigation.
The best chemistry IAs are those where the student has identified a chemical question they are genuinely curious about, designed an experiment specifically to answer it using techniques available in a school lab, generated quantitative data with genuine uncertainty, and engaged critically with what the results mean and where the methodology introduced specific sources of error. The topic area matters less than whether this description applies to the investigation. A well-executed investigation on a simple chemical reaction will outperform a poorly executed investigation on an impressive-sounding synthesis every time.
Chemistry IA topics that allow you to compare your experimental result to a literature value have a structural advantage in the Evaluation criterion. When you can calculate a percentage error between your experimental enthalpy change, equilibrium constant, rate constant, or concentration, and the published value for the same or analogous system, you have a concrete foundation for evaluating your methodology: is the discrepancy within the range your identified uncertainties could explain, or does it suggest a systematic error in your method? This question, asked and answered seriously, earns marks that generic evaluations do not.
The Criteria Applied to Chemistry: What Each One Needs
Criterion
Max Marks
What Chemistry Specifically Needs
Where Chemistry IAs Most Often Lose Marks
Personal Engagement
2
A genuine personal motivation for the chemical question, or independent methodological choices that go beyond the standard textbook protocol and reflect individual chemical thinking
Choosing a topic directly from a recommended list with no personal connection; following a standard protocol with no visible individual choices; writing a personal engagement paragraph that describes interest without showing it in the investigation itself
Exploration
6
A specific research question naming the exact independent variable, its range, and the precise dependent variable with units; chemical background at appropriate depth connecting the investigation to bonding, kinetics, thermodynamics, or another syllabus area; a justified experimental design with all controlled variables identified and their effect explained
Research question too broad to design a specific experiment; chemical background describes the topic superficially without explaining the mechanism relevant to the investigation; controlled variables listed without explaining what would happen to the results if they were not controlled
Analysis
6
Quantitative data in well-formatted tables with units and raw uncertainties; processed data with propagated uncertainties shown explicitly; graphs with error bars derived from uncertainty analysis; a trend identified and interpreted in terms of chemical theory; statistical analysis where appropriate
No uncertainty analysis or propagation; graphs without error bars; trend description that does not connect to a chemical mechanism; no comparison between experimental and literature values where these exist
Evaluation
6
Specific methodological limitations with their direction of effect on the results named precisely; comparison of experimental result to a literature or theoretical value with discussion of discrepancy; realistic improvements that specifically address each identified limitation; consideration of whether the conclusion is justified by the data
Generic limitations (more repeats, more precise equipment) with no connection to the specific methodology; no comparison to literature values; improvements that are generic rather than specifically addressing the identified limitation; conclusion stated without justification from the data
Communication
4
Logical structure from research question through background, methodology, results, analysis, and evaluation; chemical formulae, equations, and nomenclature used correctly throughout; tables with correct headings including units; graphs with labelled axes, units, and title; appropriate significant figures consistent with measurement precision
Incorrect chemical formulae or equations; inconsistent significant figures; missing units on tables or graphs; no clear structure distinguishing sections; referencing absent or inconsistent
The Evaluation criterion is where chemistry IAs most consistently underperform relative to the quality of the experimental work. A student who has run a careful titration series, calculated concentrations accurately with propagated uncertainties, and identified a clear trend in their results often writes an evaluation that consists of three generic sentences about repeating the experiment more times and using a more accurate balance. This evaluation earns one mark out of six regardless of how strong the rest of the investigation is.
What a strong chemistry Evaluation looks like is specific: the student identifies that the indicator end-point in their titration may have been reached consistently one drop too late due to the indicator’s colour change range spanning the equivalence point imprecisely, that this would systematically increase the recorded titre by approximately 0.05 mL per trial, that this would cause a systematic overestimate of the analyte concentration of approximately 0.2%, and that replacing the visual indicator with a pH meter and titration curve would eliminate this systematic error. This is what six-mark Evaluation language looks like.
Building a Research Question That Works
The chemistry IA research question needs to specify the independent variable with its range, the dependent variable with how it will be measured, and the chemical system being investigated with enough specificity to design a controlled experiment. A question missing any of these elements cannot be fully investigated, which undermines Exploration from the start.
Weak Research Question
Problem
Stronger Version
How does concentration affect reaction rate?
Does not specify the reaction, the concentration range, which reactant’s concentration is varied, or how rate will be measured
How does the initial concentration of sodium thiosulfate between 0.05 mol/dm3 and 0.25 mol/dm3 affect the initial rate of reaction with dilute hydrochloric acid, measured by the time taken for a cross to become invisible through the precipitate formed?
What is the vitamin C content of different juices?
This is a measurement question not an investigation question. There is no independent variable being manipulated and no chemical mechanism to investigate.
How does the duration of heating at 80°C between 0 and 30 minutes affect the vitamin C concentration of fresh orange juice, measured by iodine titration?
How does temperature affect the rate of a reaction?
No specific reaction, no temperature range, no measurement method specified. Could describe thousands of different experiments.
How does temperature between 20°C and 60°C affect the rate constant of the reaction between potassium permanganate and oxalic acid, measured by colorimetry, and what activation energy does the Arrhenius plot indicate?
Does pH affect the colour of anthocyanins?
Does not specify the anthocyanin source, the pH range, or how colour change will be quantified. ‘Colour’ is not a measurable dependent variable without specification of the measurement method.
How does pH between 2 and 12 affect the absorbance of red cabbage anthocyanin solution at 530 nm, measured by UV-Vis spectrophotometry, and does the relationship allow it to be used as a pH indicator?
How does the type of acid affect pH?
Comparing different acids at unspecified concentrations is not an investigable question with a clear chemical focus.
How does the concentration of ethanoic acid between 0.1 mol/dm3 and 1.0 mol/dm3 affect the pH, and does the measured pH agree with the value predicted from the Ka of ethanoic acid?
The strongest chemistry research questions are those where the expected result is chemically predictable, the experimental test of that prediction is genuine, and any deviation from the prediction is as interesting as confirmation of it. A question about how temperature affects a rate constant is strong because the Arrhenius equation makes a specific quantitative prediction about the relationship, the student can test this prediction experimentally, and the activation energy derived from the data can be compared to published values. This structure, prediction, test, comparison, generates strong Analysis and Evaluation naturally.
IB Chemistry IA Ideas by Topic Area
The ideas below are organised by the main chemical topic areas of the IB syllabus. Each includes the research question format, the chemical background required, what generates the data and how it is analysed, and what makes it strong or weak across the five criteria. These are starting points. The specific concentrations, temperature range, chemicals, and measurement method need to be chosen to fit your lab resources and personalised to reflect genuine choices rather than default options.
Kinetics: Rate Laws, Temperature, and Activation Energy
Kinetics investigations are among the most reliably strong chemistry IAs because they generate quantitative rate data, connect directly to the core and HL syllabus content on collision theory and the Arrhenius equation, allow meaningful uncertainty analysis, and produce results that can be compared to published activation energy values. The key is choosing a reaction where the rate can be measured reliably and precisely enough to detect the trend being investigated.
Topic Idea
Research Question Focus
How Rate Is Measured
What Makes It Strong
Effect of concentration on initial rate (clock reaction)
How does the initial concentration of [reactant] affect the initial rate of the iodine clock reaction, and what order of reaction does the data indicate with respect to that reactant?
Time for blue-black colour to appear (reciprocal of time used as proxy for initial rate)
Generates clean quantitative data. Rate law determination is a specific HL skill directly examined in Paper 3. Order determination from data is a structured analysis task with clear right and wrong answers. Strong on Analysis.
Arrhenius activation energy determination
How does temperature between [20°C and 60°C] affect the rate constant of [specific reaction], and what activation energy does the Arrhenius plot indicate?
Rate constant calculated from initial rate measurements at each temperature; ln(k) vs 1/T graph gives gradient equal to -Ea/R
HL syllabus connection to Arrhenius equation is direct. Produces a linearised graph with a gradient that gives Ea. Comparison to literature value of Ea generates strong Evaluation. Strong on Analysis and Evaluation.
Effect of catalyst concentration on reaction rate
How does the concentration of [homogeneous catalyst] between [range] affect the initial rate of [specific reaction]?
Colorimetry or time-based measurement depending on the reaction and catalyst chosen
Catalysis is a conceptually rich topic connecting to activation energy and the mechanism of catalytic action. Evaluation benefits from discussion of catalyst recovery, side reactions, and whether the catalyst is truly homogeneous throughout.
Effect of surface area on heterogeneous reaction rate
How does the particle size of [solid reactant] affect the rate of reaction with [aqueous reactant], measured by [gas volume or mass loss per unit time]?
Volume of gas produced per minute, or mass of reaction vessel measured at regular intervals
Connects surface area to collision frequency in a directly measurable way. Uncertainty in particle size measurement is a genuine and specific limitation worth discussing. Strong on Evaluation.
Comparing rate of hydrolysis across different esters
How does the chain length of the alcohol component in [series of esters] affect the rate of alkaline hydrolysis, measured by conductivity change?
Conductivity increases as the ester hydrolyses to produce ions; rate of conductivity change reflects rate of hydrolysis
Connects organic chemistry to kinetics in an unusual way. Conductimetric measurement is precise and generates continuous data. Personal Engagement strong if ester series is personally chosen based on structural interest.
Thermodynamics and Enthalpy
Thermodynamics investigations involve measuring temperature changes in chemical reactions and using calorimetry to calculate enthalpy changes. They are among the most technically accessible chemistry IAs and among those with the clearest connection to a literature value for comparison. The main challenge is controlling heat loss accurately enough to generate data with meaningful uncertainty analysis, and the main Evaluation opportunity is the systematic underestimation of enthalpy change that heat loss introduces.
Topic Idea
Research Question Focus
Key Measurement
Evaluation Strength
Enthalpy of combustion of alcohols
How does the number of carbon atoms in primary alcohols between methanol and pentanol affect the enthalpy of combustion per mole, and how do experimental values compare to those calculated from bond enthalpies?
Temperature rise of a measured volume of water above a spirit lamp burning a weighed mass of alcohol
Very strong: systematic error from heat loss to surroundings and incomplete combustion are specific, directional, and quantifiable. Comparison to bond enthalpy calculation and published values gives three-way comparison for Evaluation.
Enthalpy of neutralisation across acid types
How does the enthalpy of neutralisation of strong acid with strong base compare to weak acid with strong base, and can the difference be explained in terms of the enthalpy of dissociation of the weak acid?
Temperature rise when mixing equal volumes of acid and base at known concentrations in an insulated container
Strong conceptual connection to acid dissociation and the Born-Haber-type cycle connecting weak and strong acid neutralisation. Literature values readily available. Evaluation discusses heat capacity of the calorimeter and the effect of assuming it is zero.
Effect of concentration on enthalpy of dissolution
How does the concentration of [salt] solution produced affect the measured enthalpy of dissolution, and does the relationship conform to the prediction from thermodynamic activity theory?
Temperature change when dissolving a weighed mass of salt in a measured volume of water at each concentration
Genuinely interesting because the enthalpy of dissolution can be concentration-dependent at high concentrations due to ion-ion interactions. This deviation from ideal behaviour is a substantive chemical observation to discuss in Evaluation.
Hess’s Law verification
Does the enthalpy change for the formation of magnesium oxide by direct combustion equal the value calculated using Hess’s Law from two indirect routes, and what systematic errors explain any discrepancy?
Three separate enthalpy measurements: combustion of Mg, dissolution of MgO in HCl, dissolution of Mg in HCl
Direct experimental test of a fundamental thermodynamic law. Discrepancy between direct and indirect values generates rich Evaluation about which route introduces more systematic error and why. Strong on Analysis (Hess’s Law calculation) and Evaluation.
Enthalpy of displacement reaction across metal series
How does the reactivity series position of [metal] relative to [displaced metal] affect the enthalpy of displacement reaction, and does the trend correlate with electrode potential differences?
Temperature rise when adding excess metal powder to metal ion solution in an insulated container
Connects thermodynamics to electrochemistry through electrode potentials. Allows quantitative comparison between experimental enthalpy and the value predicted from standard electrode potential difference. Strong on Analysis and Evaluation.
Equilibrium and Acid-Base Chemistry
Equilibrium and acid-base investigations connect to some of the most heavily examined content in IB Chemistry and generate quantitative data through pH measurement and titration. The opportunity to compare experimental equilibrium constants or pH values to calculated values from known Ka or Kb values is one of the clearest routes to strong Analysis and Evaluation in any chemistry IA.
Topic Idea
Research Question Focus
Measurement Method
Connection to Syllabus
Determining Ka of a weak acid from pH measurement
How does the pH of [weak acid] solutions at known concentrations compare to values predicted from the published Ka, and what Ka value does the experimental pH data indicate?
pH measurement of prepared solutions at multiple concentrations; Ka calculated from pH and initial concentration
Direct application of weak acid equilibrium calculations from the syllabus. Generates a Ka value to compare to literature. Evaluation discusses junction potential in pH meter, activity effects at high concentration, and temperature dependence of Ka.
Effect of ionic strength on weak acid pH
How does the addition of [inert salt] at concentrations between [range] affect the measured pH of a [weak acid] solution of fixed initial concentration?
pH measurement of weak acid solution with increasing concentration of added salt at constant temperature
Tests the effect of ionic strength on activity and therefore on measured pH, which is a deviation from simple Ka calculations. Genuinely original question that connects to physical chemistry beyond the standard syllabus. Strong on Personal Engagement.
Buffer capacity as a function of buffer composition
How does the molar ratio of [weak acid] to its conjugate base affect the buffer capacity of a [specific buffer system], measured by the volume of strong acid or base required to change pH by one unit?
Titration of buffers of different compositions with standardised HCl or NaOH; pH monitoring throughout
Direct investigation of the Henderson-Hasselbalch relationship and buffer capacity. The maximum buffer capacity at a 1:1 ratio is a testable prediction. Strong connection to HL acid-base content. Evaluation discusses whether prepared buffer ratios were accurate.
Determining Ksp from conductimetric measurement
How does the measured conductivity of a saturated solution of [sparingly soluble salt] allow calculation of Ksp, and how does this compare to the published value?
Conductivity measurement of saturated solution; ion concentrations calculated from molar conductivity and stoichiometry
Connects equilibrium constant to electrochemistry through conductivity. HL extension topic directly. Comparison to published Ksp gives clear Evaluation foundation. Requires molar conductivity data from literature.
Le Chatelier verification with chromate-dichromate equilibrium
How do changes in pH and temperature affect the position of the chromate-dichromate equilibrium, as indicated by the absorbance at [wavelength] measured by colorimetry?
Absorbance measurement at 440 nm (chromate) and 350 nm (dichromate) or a single wavelength ratio approach as pH and temperature change
Directly tests Le Chatelier’s principle with a visually dramatic and quantitatively measurable colour change. Connects equilibrium, colour, and transition metal chemistry. Safety consideration of chromate toxicity must be addressed in Exploration.
Electrochemistry
Electrochemical investigations connect to standard electrode potentials, cell voltage, and Faraday’s law of electrolysis. They are technically accessible in most school labs, generate clearly quantitative data in the form of measured voltages or masses deposited, and connect directly to the electrochemistry section of the syllabus that is examined in Papers 2 and 3. The comparison of measured cell potentials to calculated values from standard electrode potentials provides a natural Evaluation foundation.
Topic Idea
Research Question Focus
What Is Measured
Key Evaluation Point
Effect of concentration on cell voltage: Nernst equation
How does the concentration of [metal ion] in the half-cell between [range] affect the cell voltage, and does the relationship conform to the Nernst equation prediction?
Cell voltage measured with a high-resistance voltmeter as concentration is varied; Nernst equation predictions calculated and compared
Direct test of the Nernst equation at HL level. Generates a quantitative prediction to compare against. Deviations at extreme concentrations due to activity effects provide rich Evaluation material. Strong on Analysis and Evaluation.
Faraday’s law verification: mass deposited during electrolysis
How does the charge passed during electrolysis of [metal salt solution] affect the mass of metal deposited at the cathode, and how does the experimental relationship compare to the prediction from Faraday’s law?
Mass of cathode before and after electrolysis at different charges passed (controlled by current and time); Faraday’s law prediction calculated for comparison
Direct experimental test of a fundamental electrochemical law. Systematic errors from parallel reactions at the electrode, current efficiency, and poor adherence of the deposit are specific and discussable. Strong on Evaluation.
Comparing measured cell voltages to standard electrode potential predictions
How do the measured cell voltages of electrochemical cells formed from [series of metal/metal ion half-cells] compare to values predicted from standard electrode potentials?
Measured voltage of cells formed from paired half-cells; predicted value calculated from difference in standard electrode potentials
Tests the standard electrode potential table directly. Deviations from predicted values due to non-standard concentrations, junction potentials, and polarisation are specific Evaluation points. Strong connection to electrochemistry content.
Effect of electrolyte concentration on electrolytic efficiency
How does the concentration of [electrolyte] between [range] affect the energy efficiency of electrolysis, measured as the ratio of electrical energy input to chemical energy equivalent of metal deposited?
Mass of metal deposited per unit charge at different electrolyte concentrations; energy efficiency calculated
Genuinely original question connecting electrochemistry to energy efficiency, which has real industrial relevance. Personal Engagement strong if student connects to interests in energy technology or sustainability.
Galvanic cell voltage as a function of metal reactivity series position
How does the position of two metals in the electrochemical series predict the measured cell voltage when they form a galvanic cell, and how accurately does the standard reduction potential difference predict the observed voltage?
Measured voltage of cells formed from metals spanning the reactivity series; predicted voltages from standard electrode potential table
Systematic comparison across multiple cells allows pattern analysis. Students who extend beyond simple comparison to examine why deviations occur in specific pairs produce the most interesting Evaluation.
Organic Chemistry
Organic chemistry IAs are less common than kinetics or thermodynamics investigations, primarily because organic reactions in a school lab are slower, require more careful safety management, and produce less immediately quantitative data. When they are done well, they tend to stand out because they are more unusual. The best organic chemistry IAs either investigate the kinetics of an organic reaction using indirect measurement, compare the products of reactions with structural variants, or use spectroscopic data to characterise a synthesised product.
Topic Idea
Research Question Focus
How Chemistry Is Quantified
Practical Considerations
Effect of structural variation on ester synthesis yield
How does the chain length of the alcohol component in [series of Fischer esterification reactions] affect the percentage yield of the ester product, and can the trend be explained by steric effects on the rate of nucleophilic addition?
Mass of purified ester collected after reaction, washing, and drying; percentage yield calculated from theoretical yield
Requires separatory funnel for washing and a reliable purification step. Yield measurement introduces significant uncertainty from incomplete purification. Personal Engagement strong if ester series has personal relevance such as food flavourings.
Rate of saponification of different esters
How does the chain length of the ester group in [series of esters] affect the rate of alkaline hydrolysis, measured by conductivity change over time?
Conductivity of reaction mixture increases as ionic soap product forms; rate constant from conductivity-time graph
Connects organic reaction mechanism to kinetics in a novel way. Rate constant allows direct comparison across esters. Evaluation discusses whether conductivity change is a perfectly linear function of conversion and why it might not be.
Investigating the iodine number of different fats and oils
How does the degree of unsaturation of [series of fats or oils] affect the iodine number, and does the trend correlate with the known fatty acid composition?
Volume of standardised iodine solution consumed by a weighed mass of fat or oil; iodine number calculated
Directly relevant to nutrition and food science, which creates natural Personal Engagement opportunities. Literature values for iodine number of common fats and oils allow comparison. Safety consideration of iodine solution handling must be addressed.
Effect of pH on the rate of aspirin hydrolysis
How does pH between [range] affect the rate of hydrolysis of aspirin, measured by the absorbance of the salicylate product at 530 nm?
UV-Vis absorbance at 530 nm after adding iron(III) chloride to form coloured complex with salicylate; rate from absorbance-time graph
Genuinely interesting because aspirin hydrolysis is both acid-catalysed and base-catalysed, producing a U-shaped rate-pH curve. This non-monotonic relationship is a substantive chemical observation. The mechanism of each pathway can be discussed in the background.
Comparing natural and synthetic indicator behaviour
How does the pH range over which [natural plant-derived anthocyanin] changes colour compare to a synthetic indicator of similar pKin, measured by absorbance spectrophotometry?
Absorbance spectra of the indicator solution at multiple pH values; colour change range identified from spectrophotometric data rather than visual observation
Avoids the subjectivity of visual colour comparison by using quantitative absorbance data. Connects organic chemistry of anthocyanins to acid-base indicator theory. Personal Engagement strong if plant source is personally meaningful.
Spectroscopy and Analytical Chemistry
Analytical chemistry investigations use instrumental techniques to measure chemical quantities, and they often generate the most precise and statistically tractable data of any chemistry IA type. Colorimetry and UV-Vis spectrophotometry are accessible in most school labs and generate continuous absorbance data that connects to Beer-Lambert’s law and allows quantitative analysis. These investigations require calibration curves, which are themselves a rich source of Analysis content.
Topic Idea
Research Question Focus
Technique
What Makes It Strong
Beer-Lambert law verification and quantitative analysis
Does the absorbance of [coloured solution] at [wavelength] follow Beer-Lambert’s law across the concentration range [range], and what is the molar absorption coefficient?
UV-Vis spectrophotometry at the wavelength of maximum absorbance; calibration curve of absorbance vs concentration
Direct experimental test of Beer-Lambert’s law. Molar absorption coefficient calculated from gradient of calibration curve and compared to literature. Deviations from linearity at high concentration are a specific and chemically interesting Evaluation point.
Comparing iron content of different food sources by colorimetry
How does the iron content of [series of food samples] compare when measured by thiocyanate colorimetry, and how does this compare to nutritional labelling?
Absorbance of iron-thiocyanate complex at 480 nm; iron concentration from calibration curve; comparison to label values
Natural Personal Engagement if food sources are personally chosen. Comparison to nutritional labelling gives Evaluation foundation. Systematic error from incomplete extraction of iron from the food matrix is a specific and important limitation.
Effect of solvent polarity on UV-Vis absorbance of an indicator
How does the polarity of the solvent affect the wavelength of maximum absorbance of [organic dye], and can this be explained in terms of solvent-chromophore interactions?
UV-Vis absorbance spectra of the same dye dissolved in solvents of different polarity (water, ethanol, acetone, hexane)
Connects spectroscopy to intermolecular forces and solvent effects on electronic transitions. Solvatochromism is a real photochemical phenomenon with clear mechanistic explanation. Personal Engagement strong if dye is personally chosen. Original enough that examiners recognise genuine investigative thinking.
Determining the concentration of caffeine in beverages by UV absorbance
How does the caffeine concentration of [series of beverages] compare to label values, as measured by UV absorbance at 273 nm?
UV absorbance at 273 nm after extraction of caffeine from beverage; concentration from calibration curve
Personal Engagement almost always strong given caffeine’s relevance to students’ daily lives. Extraction efficiency is a genuine and specific systematic error. Comparison to label values provides Evaluation foundation.
Investigating the formation constant of a complex ion by spectrophotometry
How does the absorbance of [transition metal ion] solution change as [ligand] concentration is increased, and what formation constant does the data indicate for the complex?
Absorbance at the wavelength of maximum change as ligand is added; formation constant calculated from the titration curve at the equivalence point
HL connection to coordination chemistry and complex ion formation. Formation constant is a quantitative output that can be compared to literature. Job’s method of continuous variations is an advanced analytical technique that demonstrates genuine chemical sophistication.
Topics That Consistently Underperform
Overused or Weak Topic
Why It Underperforms
What to Do Instead
Vitamin C content of different fruit juices by iodine titration
No independent variable is being investigated, just a comparison of a fixed property across samples. The investigation has no hypothesis to test and no chemical mechanism to explain differences. Personal Engagement is almost impossible to demonstrate genuinely.
Investigate how a specific treatment such as heating, exposure to air, or pH change affects the vitamin C content of a single juice over time. This creates a genuine rate or degradation question with a chemical mechanism to explain.
Aspirin synthesis and percentage yield
The synthesis protocol is standard, the yield is determined primarily by practical technique rather than any chemical variable being investigated, and there is nothing to discover. Personal Engagement is very difficult, and Evaluation is limited to procedural errors.
Investigate how a specific reaction condition such as temperature, acid catalyst concentration, or reaction time affects the yield or purity of the aspirin product. This creates a genuine independent variable and a mechanistic question about which step is rate-limiting.
Standard enthalpy of combustion of alcohols without Arrhenius extension
This is one of the most common chemistry IA topics globally. Without an additional dimension such as the Arrhenius analysis, the investigation is entirely standard, the results are predictable, and the Evaluation writes itself from the textbook.
Add the Arrhenius dimension by measuring rate constants at multiple temperatures or investigate bond enthalpy calculations as a comparison to experimental values. Either extension creates genuine Analysis content and a more specific Evaluation.
Comparing the effectiveness of different antacids
Measuring the volume of acid neutralised by different antacid tablets is a comparison of a property, not an investigation of a chemical mechanism. The result depends on the mass of active ingredient per tablet, which is labelled on the packaging, so the investigation has nothing to discover.
Investigate how the rate of antacid neutralisation depends on particle size, temperature, or concentration of acid. This creates a kinetics question with a collision theory explanation and allows the rate-limiting step to be discussed.
Effect of temperature on solubility of a salt
The temperature-solubility relationship is well-established, the data is available in textbooks, and the investigation rarely generates sufficient data points or uncertainty analysis to merit strong Analysis marks. Personal Engagement is almost impossible.
Investigate the temperature dependence of solubility to extract the enthalpy of dissolution using a van’t Hoff plot. This connects solubility to thermodynamics, generates a ln(solubility) vs 1/T graph with a gradient that gives the enthalpy, and provides a literature value for comparison.
Uncertainty Analysis: The Chemistry IA Skill That Separates 6s from 7s
Uncertainty analysis is the aspect of the IB Chemistry IA that most consistently distinguishes investigations scoring in the 6 band on Analysis from those scoring full marks. It is also the aspect that most students underdo, either because they were not taught it explicitly, or because they treat it as a formality rather than a genuine component of the investigation.
The IB expects students to record the absolute uncertainty of every measurement based on the precision of the instrument used, to propagate these uncertainties through calculations to arrive at an uncertainty on the final result, and to use the uncertainty on the final result to evaluate whether their measurement is consistent with a literature value. This is not a bureaucratic requirement. It is the quantitative foundation of the Evaluation: the question of whether your discrepancy from the literature value is significant depends entirely on whether it falls within or outside your calculated experimental uncertainty.
Measurement Type
How to Determine Uncertainty
How to Propagate It
Example
Single reading instrument (thermometer, pH meter, colorimeter)
Half the smallest division for analogue instruments; the stated precision for digital instruments
Add absolute uncertainties for addition and subtraction; add percentage uncertainties for multiplication and division
Thermometer reading: 25.0°C, precision 0.1°C, absolute uncertainty ±0.05°C. For a temperature change: 45.0°C minus 25.0°C equals 20.0°C, absolute uncertainty ±0.05 + ±0.05 equals ±0.10°C, percentage uncertainty 0.10/20.0 times 100 equals 0.5%.
Burette (titration volume)
The uncertainty in a titre is the sum of the uncertainties at the initial and final readings; for a 50 mL burette graduated to 0.1 mL, each reading has uncertainty of ±0.05 mL, so a titre has uncertainty of ±0.10 mL
Percentage uncertainty in titre equals ±0.10 mL divided by titre volume times 100; this percentage uncertainty propagates directly to the calculated concentration
Titre of 22.50 mL: percentage uncertainty equals 0.10/22.50 times 100 equals 0.44%. A titre of 5.00 mL: percentage uncertainty equals 0.10/5.00 times 100 equals 2.0%. This is why small titres produce high percentage uncertainties.
Mass on a balance
The uncertainty is ±0.001 g for a 4-decimal-place balance, ±0.01 g for a 3-decimal-place balance
Percentage uncertainty in mass equals absolute uncertainty divided by mass times 100; for small masses this becomes significant
Mass of 0.52 g on a 3-decimal-place balance: absolute uncertainty ±0.005 g, percentage uncertainty 0.005/0.52 times 100 equals 0.96%.
Calculated result from multiple measurements
Add percentage uncertainties of all measurements that were multiplied or divided; add absolute uncertainties of all measurements that were added or subtracted
The percentage uncertainty on the final result equals the sum of all contributing percentage uncertainties
Concentration calculated from titre and mass: percentage uncertainty on concentration equals percentage uncertainty on titre plus percentage uncertainty on mass. If titre uncertainty is 0.44% and mass uncertainty is 0.96%, total uncertainty on concentration is approximately 1.4%.
The comparison of your experimental result to a literature value using the calculated uncertainty is the most powerful single tool for generating strong Evaluation content. If your experimental enthalpy of combustion of ethanol is -1200 kJ/mol with a calculated uncertainty of ±120 kJ/mol, and the literature value is -1368 kJ/mol, the discrepancy of 168 kJ/mol exceeds your calculated uncertainty of ±120 kJ/mol. This means there is likely a systematic error in your methodology beyond random measurement uncertainty, which is a specific and important Evaluation observation. Identifying what that systematic error is and why it acts in the direction it does, in this case heat loss to the surroundings causing underestimation of the true enthalpy change, earns the marks that generic evaluations do not.
Quick Reference: 30 IB Chemistry IA Ideas
Topic
Area
Key Technique
Difficulty
Iodine clock reaction: concentration vs rate law
Kinetics
Time-based rate measurement
Medium
Arrhenius activation energy from rate-temperature data
Kinetics
Rate measurement and linearised Arrhenius plot
Medium-High
Effect of catalyst concentration on reaction rate
Kinetics
Colorimetry or time-based measurement
Medium
Surface area effect on heterogeneous reaction rate
Kinetics
Gas collection or mass loss
Low-Medium
Rate of hydrolysis across ester series
Kinetics/Organic
Conductimetry
High
Enthalpy of combustion of primary alcohols
Thermodynamics
Calorimetry, spirit lamp
Medium
Enthalpy of neutralisation: strong vs weak acid
Thermodynamics
Temperature change in insulated calorimeter
Medium
Effect of concentration on enthalpy of dissolution
Thermodynamics
Calorimetry
Medium-High
Hess’s Law verification with three enthalpy measurements
Thermodynamics
Calorimetry
Medium
Enthalpy of displacement across metal reactivity series
Thermodynamics/Electrochemistry
Calorimetry
Medium
Ka determination from weak acid pH measurements
Equilibrium/Acid-Base
pH meter
Medium
Effect of ionic strength on weak acid pH
Equilibrium/Acid-Base
pH meter
High
Buffer capacity as function of acid-to-base ratio
Equilibrium/Acid-Base
pH meter and titration
Medium-High
Ksp determination by conductimetry
Equilibrium
Conductivity meter
High
Le Chatelier verification with chromate-dichromate system
Equilibrium
Colorimetry/spectrophotometry
Medium
Nernst equation: concentration vs cell voltage
Electrochemistry
High-resistance voltmeter
Medium-High
Faraday’s law verification by electrolysis
Electrochemistry
Analytical balance, ammeter
Medium
Measured vs predicted cell voltages across metal pairs
Electrochemistry
Voltmeter and electrochemical cell setup
Medium
Electrolyte concentration and electrolytic efficiency
Electrochemistry
Ammeter, balance, voltmeter
Medium-High
Galvanic cell voltage vs reactivity series position
Electrochemistry
Voltmeter
Low-Medium
Ester synthesis yield vs alcohol chain length
Organic
Gravimetric yield measurement
Medium
Saponification rate across ester series
Organic/Kinetics
Conductimetry
High
Iodine number of different fats and oils
Organic/Analytical
Iodometric titration
Medium
pH effect on aspirin hydrolysis rate
Organic/Kinetics
UV-Vis spectrophotometry
Medium-High
Natural vs synthetic indicator pH range comparison
Organic/Analytical
UV-Vis spectrophotometry
Medium
Beer-Lambert law verification and molar absorption coefficient
Analytical/Spectroscopy
UV-Vis spectrophotometry
Medium
Iron content of food sources by colorimetry
Analytical/Spectroscopy
Colorimetry and calibration curve
Medium
Solvent polarity effect on UV-Vis absorbance of a dye
Analytical/Spectroscopy
UV-Vis spectrophotometry
Medium-High
Caffeine concentration in beverages by UV absorbance
Analytical/Spectroscopy
UV absorbance at 273 nm
Medium
Formation constant of complex ion by spectrophotometry
Analytical/Spectroscopy
UV-Vis spectrophotometry, Job’s method
High
Need help developing your IB Chemistry IA?
PrepSeven tutors have guided students to top IA scores across all areas of IB Chemistry. We help you develop a specific research question, design a methodology with proper uncertainty analysis, and write an Evaluation that earns full marks.